This past school year marked the most “normal” return to schooling since the pandemic. Here’s a look into how students are doing academically and what the state can do to boost grade level standards and teacher development.
The 2023-2024 school year in Oregon, and Portland specifically, set a new baseline for our public schools. After two years of mostly remote schooling, mask mandates and other COVID disruptions, 2022-2023 was all about readjusting and resettling, making this past school year the most “normal” school year in many kids’ memories (rising 4th graders have spent the majority of their public school career during COVID).
But the year was anything but normal — especially in Portland — and legislators, parents, educators and advocates all have to reckon with the reality of public school funding, enrollment, climate and performance.
Academics and Accountability

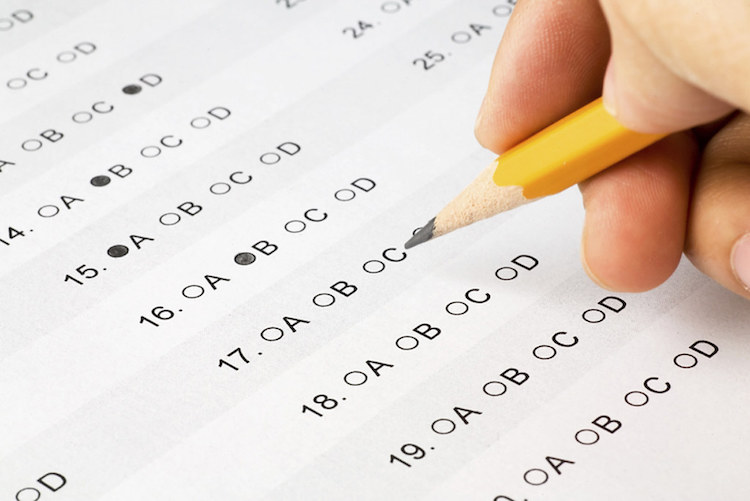
In January, researchers from Stanford University, Harvard University and Dartmouth College released the Education Recovery Scorecard, analyzing students’ academic gains and losses in the 2022-2023 school year. The data was a big wakeup call for Oregon schools. Of the 30 states whose data was analyzed, Oregon was the only state that didn’t improve in math achievement, and only two states (Nevada and Virginia) lost more ground in reading than Oregon.
“We don’t have as much poverty as the rest of the country on average,” says Sarah Pope, executive director of Stand for Children Oregon, a national educational advocacy organization with its Oregon headquarters here in Portland, “but yet our outcomes are at the bottom of the pack — and it’s much worse if you’re a child of color.”
So, what happened?
One popular argument is that Oregon’s schools were virtual too long during the pandemic; while it’s true that researchers agree this lack of face-to-face learning has had huge impacts, both Washington and California had similar length closures, but their academic gaps aren’t nearly as pronounced. One potential cause is that, when Oregon’s school districts got extra federal dollars during the early days of the COVID-19 pandemic, each district chose to spend their money differently, and at a different pace. For example, Portland Public Schools (PPS) was allocated almost $74 million dollars and has spent nearly $55 million to date, and Beaverton Public schools was allocated $46.5 million, spending $31 million so far. Other states like North Carolina, Tennessee, Mississippi, and Illinois (all of which have recovered more quickly academically than Oregon) directed school districts to spend their funds on research-aligned, high-impact strategies. PPS has rebounded much better and faster than most other districts — and their extra dollars went to tutoring and summer learning, both strategies that are aligned with well-researched best practices for increasing student learning outcomes. In fact, PPS is the only large system in the state that spent a sizable amount of dollars on those strategies. Another theory is that achieving concurrence amongst all of Oregon’s 197 school districts is next to impossible, compared to states like Florida or Rhode Island, with fewer school districts; even without a directive from the state government, it’s easier for these states to align their resources and strategies voluntarily.
“Our system does what it’s incentivized to do,” says Pope, adding that one proposed strategy is to pass more legislation providing focused funding for research-proven strategies, like the High School Success Act from 2016 or last year’s Early Literacy Success Initiative. Both of these pieces of legislation give a specific menu of research-aligned options to districts that stand the best chance of improving student outcomes.
Oregon has outpaced many other states with policies and legislation that favor equity, mental health, and diversity, particularly for LGBTQ+ students and families. If we can learn from other states’ focused efforts to hold districts accountable for the strategies they use to meet educational outcomes, our state could also be a leader when it comes to closing educational gaps.
McMinnville: A Success Story

Although Oregon has many challenges when it comes to offering quality academics and meeting accountability measures, there are districts that are outperforming the state averages. The McMinnville school district (which includes the cities of McMinnville and Lafayette) stands out across the state as a model for what other districts can do to build student skills and success — particularly for low-income students and Latinx students. Their students, 38% of whom identify as Latinx, outperform students across the state on almost every standardized testing measure, but where McMinnville really shines is in its graduation rates. Statewide, 81.3% of students graduate in four years, but in McMinnville, that rate hits 93%. The difference is even more stark when broken down demographically. Statewide, 80.7% of low-income students (those receiving free/reduced lunch) graduate on time compared to 90% in McMinnville. English language learners also fare better in McMinnville — 94% graduate on-time compared to only 65.3% statewide. Oregon’s lagging success on these measures is commonly compared to Washington state, which often outpaces our state’s progress — but McMinnville even outperforms our northern neighbor.
Kourtney Ferrua, Director of Curriculum, Instruction and Assessment, attributes student academic success to the district’s focus on using high-leverage, research-based instructional strategies, like tutoring, differentiation tools, reading intervention, trauma-informed practices, and instructional technology. McMinnville also provides high-quality professional development and support to teachers as well as to classified staff, including mentorship and the ability to earn credits towards graduate degrees. The statewide teacher attrition rate is 36% — in McMinnville, it’s less than 15%.
But most of all, the district prides itself on approaching all metrics as systemic issues. “Building strong relationships with students and families is really critical to us,” says Ferrua. Graduation rates aren’t “a problem the high school has to solve,” because of the support to students and families provided at every level. They have deep relationships with community partners like mental health providers and nonprofit organizations, along with a whole district team of family outreach and support staff “assigned specifically to work with families and identify the root cause.”
McMinnville makes a strong case that districts can’t sacrifice a strong academic program for social-emotional learning, or prioritize academic accountability over providing teachers and staff a quality work environment. Rather, all three of these elements — along with robust community and parent involvement — work in tandem toward student success.
Who’s Paying for This?

Although positive, Ferrua is uncertain about how McMinnville will be able to maintain their successful programs as the additional federal funding implemented in 2020 comes to an end. Statewide, all stakeholders seem to share one overarching concern: funding. Perhaps the one thing virtually everyone seems to agree on is that in order to move forward, solving our public education funding issues is going to be one of the first things that needs to happen.
In Oregon, public schools are paid for by state income taxes and by local property taxes, but there’s a catch. In the ’90s, measures 5 and 50 limited the proportion of property taxes that could be spent on public schools and how quickly property taxes are allowed to increase, which puts the main burden of funding public schools on the state. The state legislature covers about two-thirds of K-12 funding, which is paid out to districts based mainly on how many students are enrolled. It helps take the burden off of localities, but it means that education is constantly competing with other budget priorities like health care, social services and housing. Around 28% of the state’s legislative budget goes towards education, which seems like a sizable chunk, until that’s compared to other states — in Washington, about half of their state budget funds public schools.
In 2023, the legislature passed a $10.2 billion bill to fund K-12 education, which fills a lot of gaps, but as that extra funding from the early days of the pandemic is running out (districts must spend all of their allotted funds by September 2024), many districts will still find themselves in the red. Programs that supported student mental health, extra high-dose tutoring, and other services are facing the biggest threats. Not all Oregon districts receive funds from a local tax levy (only 18 do), which creates further gaps. For example, the recently passed Portland Teacher’s Levy will save 650 jobs across the district next year. Individual district’s foundations can help fill gaps, but this is also fraught. In May, Portland school board members voted 5-2 to combine individual schools’ foundations into one central funding source. Advocates in favor of this policy change emphasize a move toward more equitably funding schools that serve majority free and reduced lunch students and students of color — but opponents fear donors and parents will be less likely to support a district-wide foundation as opposed to their child’s individual school.
Another challenge is figuring out how much funding districts will actually need. And like many of the other issues and challenges facing Oregon schools, one answer is that all affected stakeholders — not just the folks creating the mathematical model for calculating — need to come to the table when establishing their funding needs. For the first time in a long time, schools in Oregon will be facing not just a lack of increased funding, but cuts. Although this isn’t a unique challenge — education advocates in Washington and California, among other states, also fear budget issues — because of our state’s funding model and necessity to close educational gaps, we’ll need to find a unique solution.
Future Projections

“I think we’re on the precipice of a comeback story,” says Christine Pitts, a senior fellow at nonpartisan education nonprofit, Education Northwest. But instead of inviting more voices to the table, she counters, “I think what we need is to be setting new tables.”
This sentiment is echoed amongst district staff and public education advocates, who emphasize that instead of choosing between prioritizing the needs and interests of different groups, successful public schools don’t sacrifice educator needs for social-emotional learning, or student equity for academic outcomes. This isn’t an impossible task — as seen in the example of McMinnville SD — but it requires both local advocacy and statewide leadership. It also requires an understanding that education is a long-term investment. Kourtney Ferrua argues that the real impacts of today’s low attendance and graduation rates won’t be felt for another decade, as those young people come of age without a solid educational foundation. Governor Tina Kotek has reaffirmed her commitment to reevaluating the state’s funding formula for public schools, and reviewing how the state defines school accountability; for some, this commitment gives hope that these conversations are moving in the right direction.
Oregon By the Numbers
A Data Snapshot for the 2022-2023 School Year
- Enrollment: 552,380 — 5.1% decrease since the 2018-2019 school year.
- 41% students of color
- 12.9% teachers of color
- 3.9% homeless students
- Teachers with 0-4 years experience increased from 27% in 2020-2021 to 28.6% in 2022-2023.
- Oregon spends $16,574 per student.
- Test Score Pass Rates:
English Language Arts (ELA) for grades 3-5: 43.6%
ELA for grades 6-8: 43.7%
ELA for 11th grade: 46.8%
Math for grades 3-5: 36.6%
Math for grades 6-8: 28.5%
Math for 11th grade: 20.9% - Attendance
Grades K-5: 64.2%
Grades 6-8: 64.7%
High school: 60.8% - Graduation rate overall: 81.3%
Source: Oregon Department of Education Statewide Report Card
- Stop and Smell the Wildflowers on These Family-Friendly Hikes - March 17, 2025
- Everything You Need to Know About the PPS School Lottery - December 23, 2024
- Your Guide to a Not-So-Scary Halloween - October 14, 2024
